



NETWORK VISUALIZATION AND DATA INSPECTION
2.1 - INTRODUCTION
Unlike automated pipeline-based tools, NETools provides an interactive environment focused on visual graph exploration, attribute customization, and structural analysis. This section outlines how to navigate, customize, and inspect your network data within the application.
2.2 - LOADING AND MANAGING NETWORKS
2.2.1 - CREATING A NEW PROJECT
Accessing Project Management: Navigate to the top menu and select File → New Project
A configuration window will appear prompting for project metadata:
- Project Name: Enter a unique identifier for your working session (e.g., Test_project).
- Project Description: (Optional) Add brief descriptive text regarding the analysis objectives or dataset origin.
Click OK to initialize the project. Once created, the project name and workspace status will be reflected in the top-left Datasets panel. Other project options available in the menu include Open Project, Save Project, and Delete Project.
Once an active project is established, datasets must be imported to populate the variables and network structures.
- Adding a Dataset: Click on the New Dataset on the top menu.
- Dataset Parameters: Configure the import settings according to your data file format:
- Dataset Name: Assign a name to the dataset (e.g., example_dataset).
- Dataset Type: Select the data category (e.g., GENERAL).
- CSV File: Click Browse to select the target tabular file from your local system (supported formats include CSV).
- CSV Separator & Decimal Separator: Define the delimiters used in the text file (e.g., Comma , for separation and Point . for decimals).
- Sample ID Column: Specify the column designated for sample identification (e.g., SampleID).
- Data Preview: The configuration wizard includes an integrated Data Preview panel allowing users to verify data integrity, structure, and row/column alignment prior to import.
- Finalizing Import: Click OK to load the dataset. The imported dataset will appear in the Project Datasets list displaying its type, description, and sample count, while the Variables View will automatically parse and display the associated variables (such as ID, Name, Type, Distribution, and Missing Data attributes). Datasets can also be deleted or managed using the corresponding removal tools.
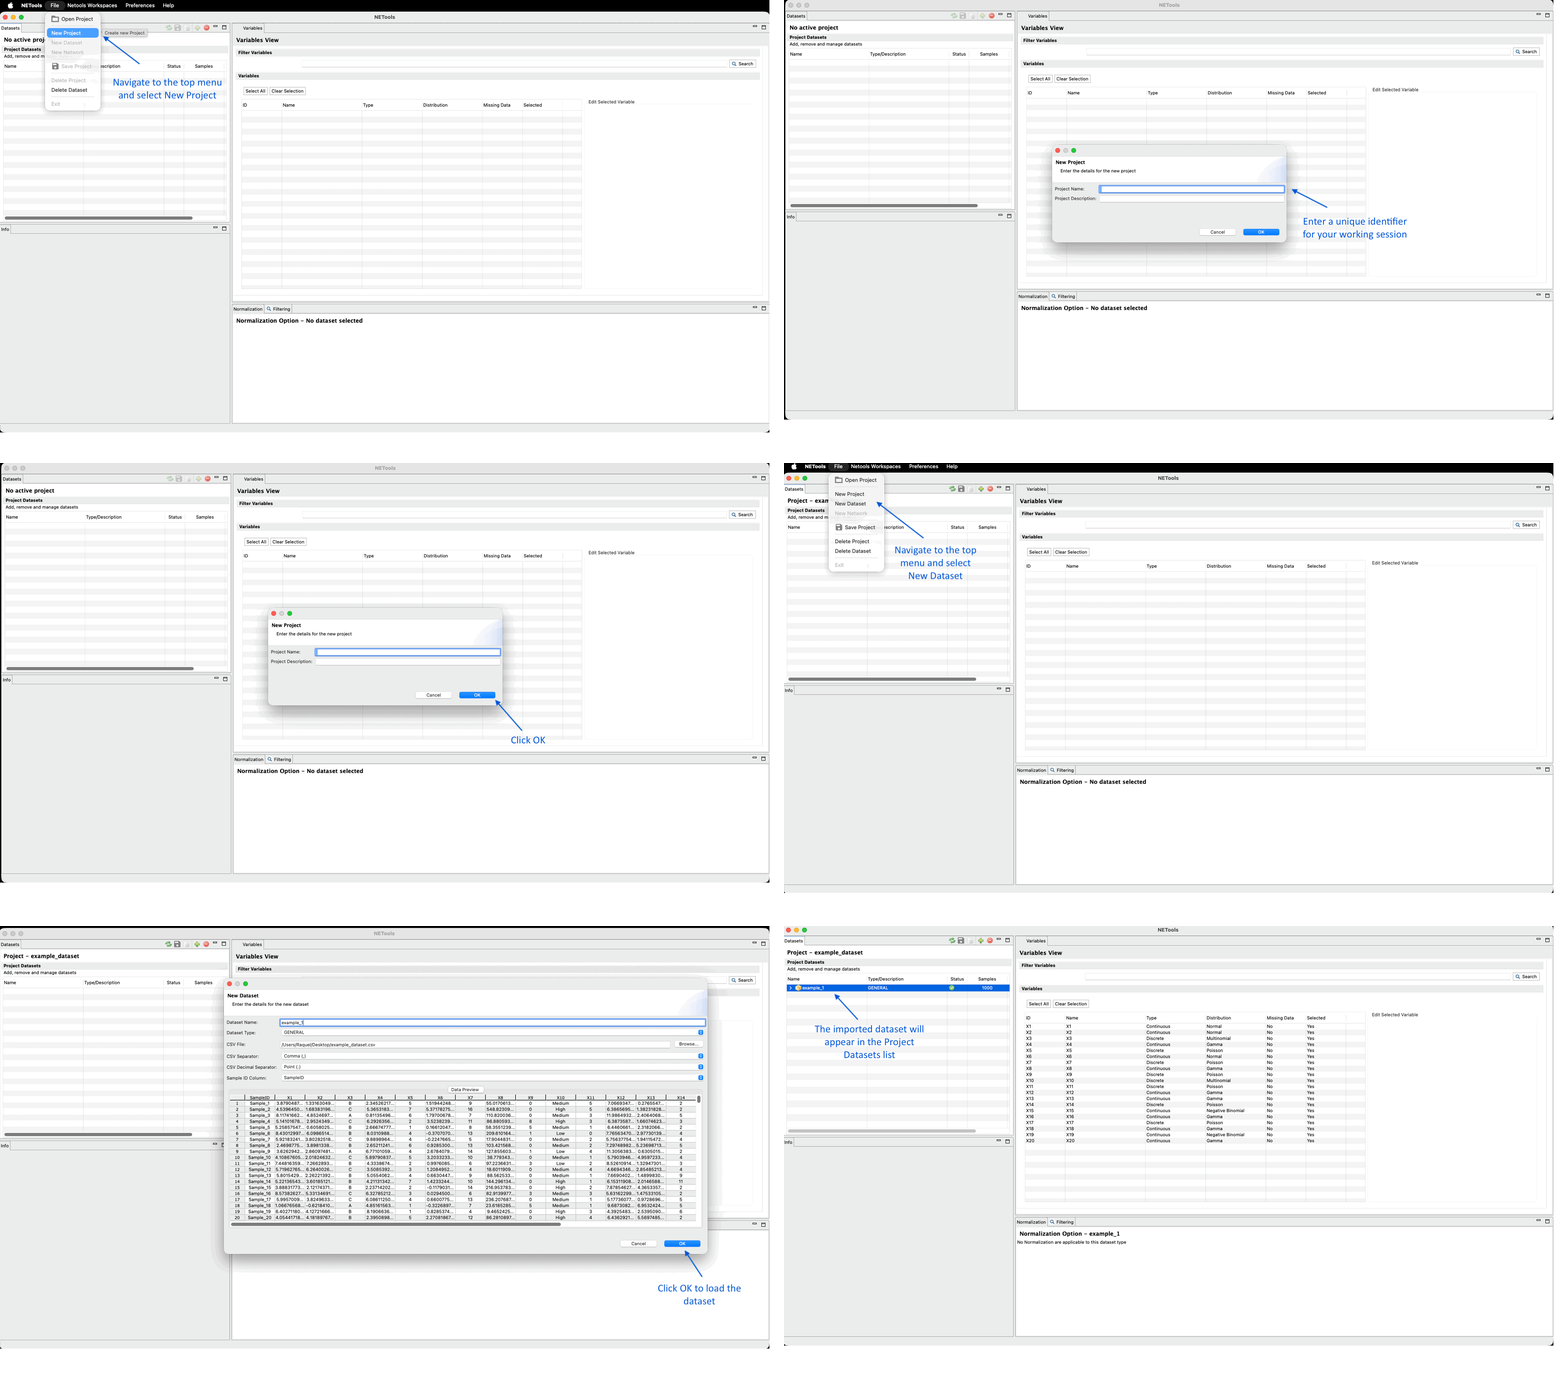
Figure 4: Creating a project and importing a dataset in NETools.
2.3 - NETWORK STRUCTURE LEARNING AND MODEL EXECUTION
Once the dataset is imported and variables are properly characterized, NETools allows users to infer and build network structures using advanced statistical and machine learning algorithms.
2.3.1 - CONFIGURING NETWORK STRUCTURE LEARNING
- Accessing the Builder: Navigate to the workspace options via the top menu to open the Network Structure Learning module.
- Structure Learning Build Dialog: A configuration wizard will prompt the user to define the model parameters:
- Network Name: Assign an identifier for the resulting network build
- Score Function: Select the scoring criterion for network optimization (e.g., BIC - Bayesian Information Criterion).
- #N Bootstrap Instances: Define the number of bootstrap iterations for robust network inference (default is typically set to 100).
- Model & Network Selection Thresholds: Configure advanced parameters such as Bootstrap Score Threshold, BIC Score Threshold, and P-Value Threshold to filter interactions and control network sparsity.
- Model Execution: Click on OK to execute the inference algorithm. Once completed, the build status will update to Ready in the Project’s Networks section.
2.3.2 - MANAGING AND ACCESSING NETWORKS
- Context Menu Operations: Right-clicking on any network entry opens a context menu with options to:
- View Network: Switches the interface to the graphical viewport to display the network topology.
- Reset: Restores default layout or parameters.
- Delete: Removes the network build from the active project.
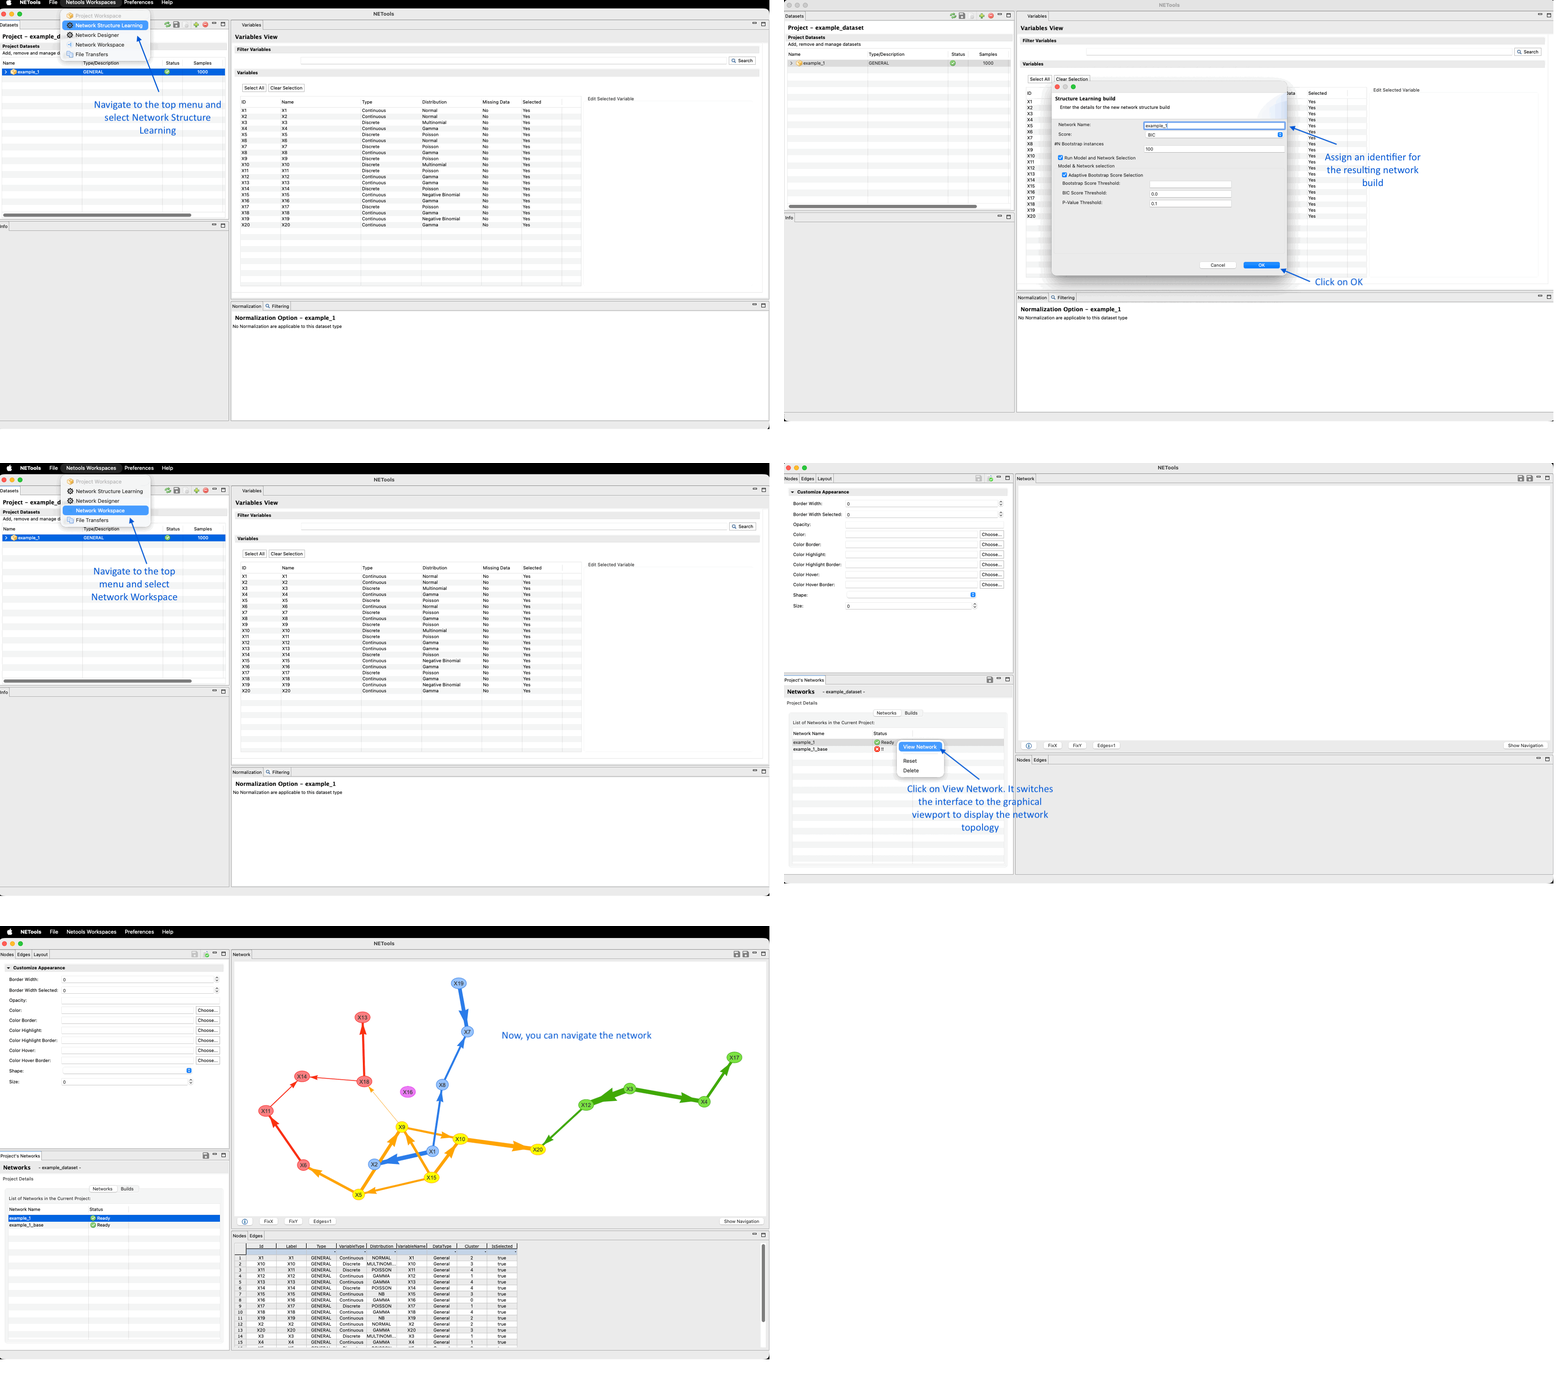
Figure 5: Configuring network structure learning and accessing the resulting network.
2.4 - NETWORK VISUALIZATION, APPEARANCE CUSTOMIZATION, AND LAYOUT CONFIGURATION
NETools provides a comprehensive and interactive graphical environment to customize, explore, and analyze network structures. The visualization interface is controlled through specialized configuration tabs located in the upper-left panel, allowing users to modify both node and edge aesthetics as well as network physical layout properties.
2.4.1 - NODES APPEARANCE CUSTOMIZATION
By selecting the Nodes tab within the appearance panel, users can fine-tune the graphical representation of all network nodes:
Border & Opacity Settings:
- Border Width: Defines the thickness of the node borders (default: 1).
- Border Width Selected: Sets the border thickness when a node is actively selected (default: 2).
- Opacity: Controls the overall transparency level of the nodes (default: 1.0).
- Color Coding Parameters: Users can customize hex color codes and use the color picker (Choose...) for different states:
- Color: Default fill color of the nodes (e.g., #97C2FC, #02ffda, #FFFF00).
- Color Border: Outline color of the standard nodes.
- Color Highlight / Color Highlight Border: Colors applied when nodes are highlighted during analysis or selection.
- Color Hover / Color Hover Border: Dynamic feedback colors when placing the cursor over a node.
Geometry and Sizing:
- Shape: Defines the geometric form of the nodes (e.g., ellipse).
- Size: Sets the scaling parameter or radius of the nodes (default: 25).
2.4.2 - EDGES APPEARANCE CUSTOMIZATION
Switching to the Edges tab allows users to configure connection lines and relationship parameters between variables:
- Color and Opacity: Configures colors for standard, highlighted, and hover states, alongside opacity levels (1.0).
Line Attributes:
- Width: Sets the thickness of the edges.
- Without Weight: Toggle option to disregard quantitative weight values in visual rendering.
- Show Dashes / Show Labels: Enables dashed line styling or displays interaction labels directly on the edges.
- Hide Edges: Option to temporarily conceal network connections for cleaner visualization.
- Smoothness and Type: Controls edge curvature types (dynamic, continuous, etc.) and roundness parameters (0.50).
2.4.3 - LAYOUT AND PHYSICS ENGINE CONFIGURATION
The Layout tab provides advanced physics simulation controls to optimize the spatial arrangement of the network graph:
- Edges Physics Settings: Configures edge type and force directions (none).
- Barnes-Hut Simulation Model: Controls spatial distribution forces using adjustable numerical sliders:
- theta (0.50): Determines Barnes-Hut optimization accuracy.
- gravitationalConstant (-2000): Controls node repulsion forces.
- centralGravity (0.30): Pulls nodes toward the center of the canvas.
- springLength (95) and springConstant (0.04): Defines edge elasticity and tension.
- damping (0.09) and avoidOverlap (0.00): Prevents visual overlapping among closely clustered nodes.
- Generic and Wind Parameters: Adjusts velocity thresholds (maxVelocity: 50, minVelocity: 0.75), solver algorithms (barnesHut), timesteps (0.5), and directional wind forces. A Restore defaults button resets the physics properties.
2.4.4 - INTERACTIVE VIEWPORT AND TABULAR DATA INSPECTION
- Viewport Navigation Tools: The main canvas includes quick-action controls at the bottom (FixX, FixY to lock coordinates, edge counters like Edges=1, and the Show Navigation toggle) for seamless interaction.
- Data Inspection Tables (Bottom-Right): Comprehensive tabular views display detailed metrics for nodes (such as Id, Label, Type, VariableType, Distribution, Cluster, and IsSelected) and edges (such as Strength, Weight, Proportion, P-values, Bootstrap Frequency). Cross-referencing between the graphical network and data tables occurs dynamically in real time.
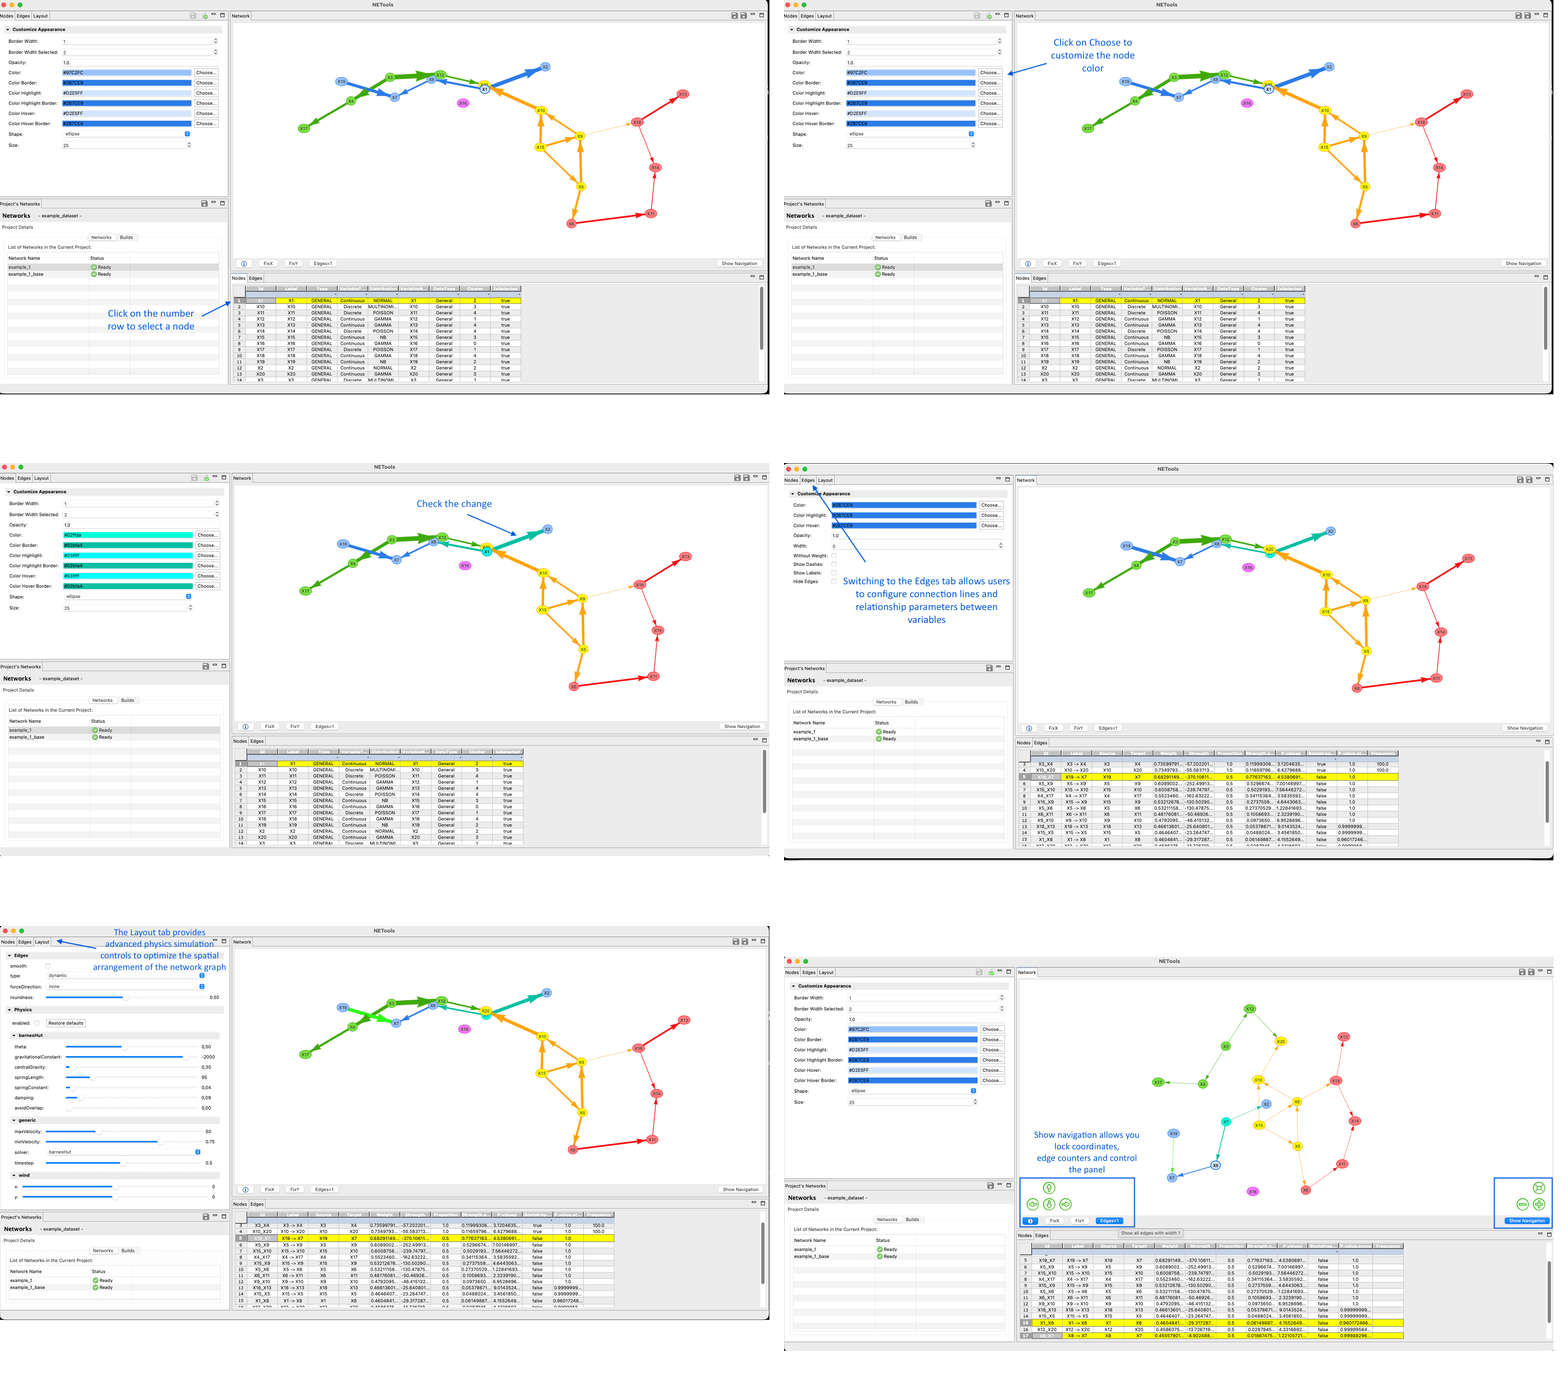
Figure 6: Customizing node and edge appearance, layout and network data inspection.
2.5 - NETWORK DESIGNER AND CUSTOMIZATION
NETools includes a specialized Network Designer module accessible via the top workspace menu (Netools Workspaces → Network Designer). This tool allows users to manually define, customize, and manage network configurations by establishing inclusion or exclusion rules using whitelist and blacklist constraints.
2.5.1 - CREATING A NETWORK DESIGN PROJECT
- Design Configuration Dialog: A window prompts for project specifications:
- Network Design Name: Enter a unique identifier for the design session.
- Project Description: Add optional descriptive notes regarding the customized network rules.
- Initialization: Click OK to create the design environment. Once active, the design appears under the Manage White and Black Lists for network design builds as active (Yes status).
2.5.2 - MANAGING WHITE LISTS AND BLACK LISTS
The Network Designer interface provides dedicated panels to control specific directional edges between variables:
- WhiteList Panel: Forces specific edges to be included in the network structure.
- Users specify the origin variable (From:), target variable (To:), and an optional justification (Reason:).
- Actions include adding (+ Add), removing (X Remove), importing lists (Import List), or clearing list items (Remove List).
- BlackList Panel: Prevents specific interactions or edges from being formed within the network topology.
- Configured similarly by defining the source (From:) and target (To:) nodes along with the exclusion reason.
- Allows manual addition, removal, or batch importing of restricted connections.
Once the whitelists and blacklists have been configured and saved, the custom network can be run again in the "Structure Learning build" section of the top menu by configuring it as described in the previous steps. The procedure to follow will be the same.
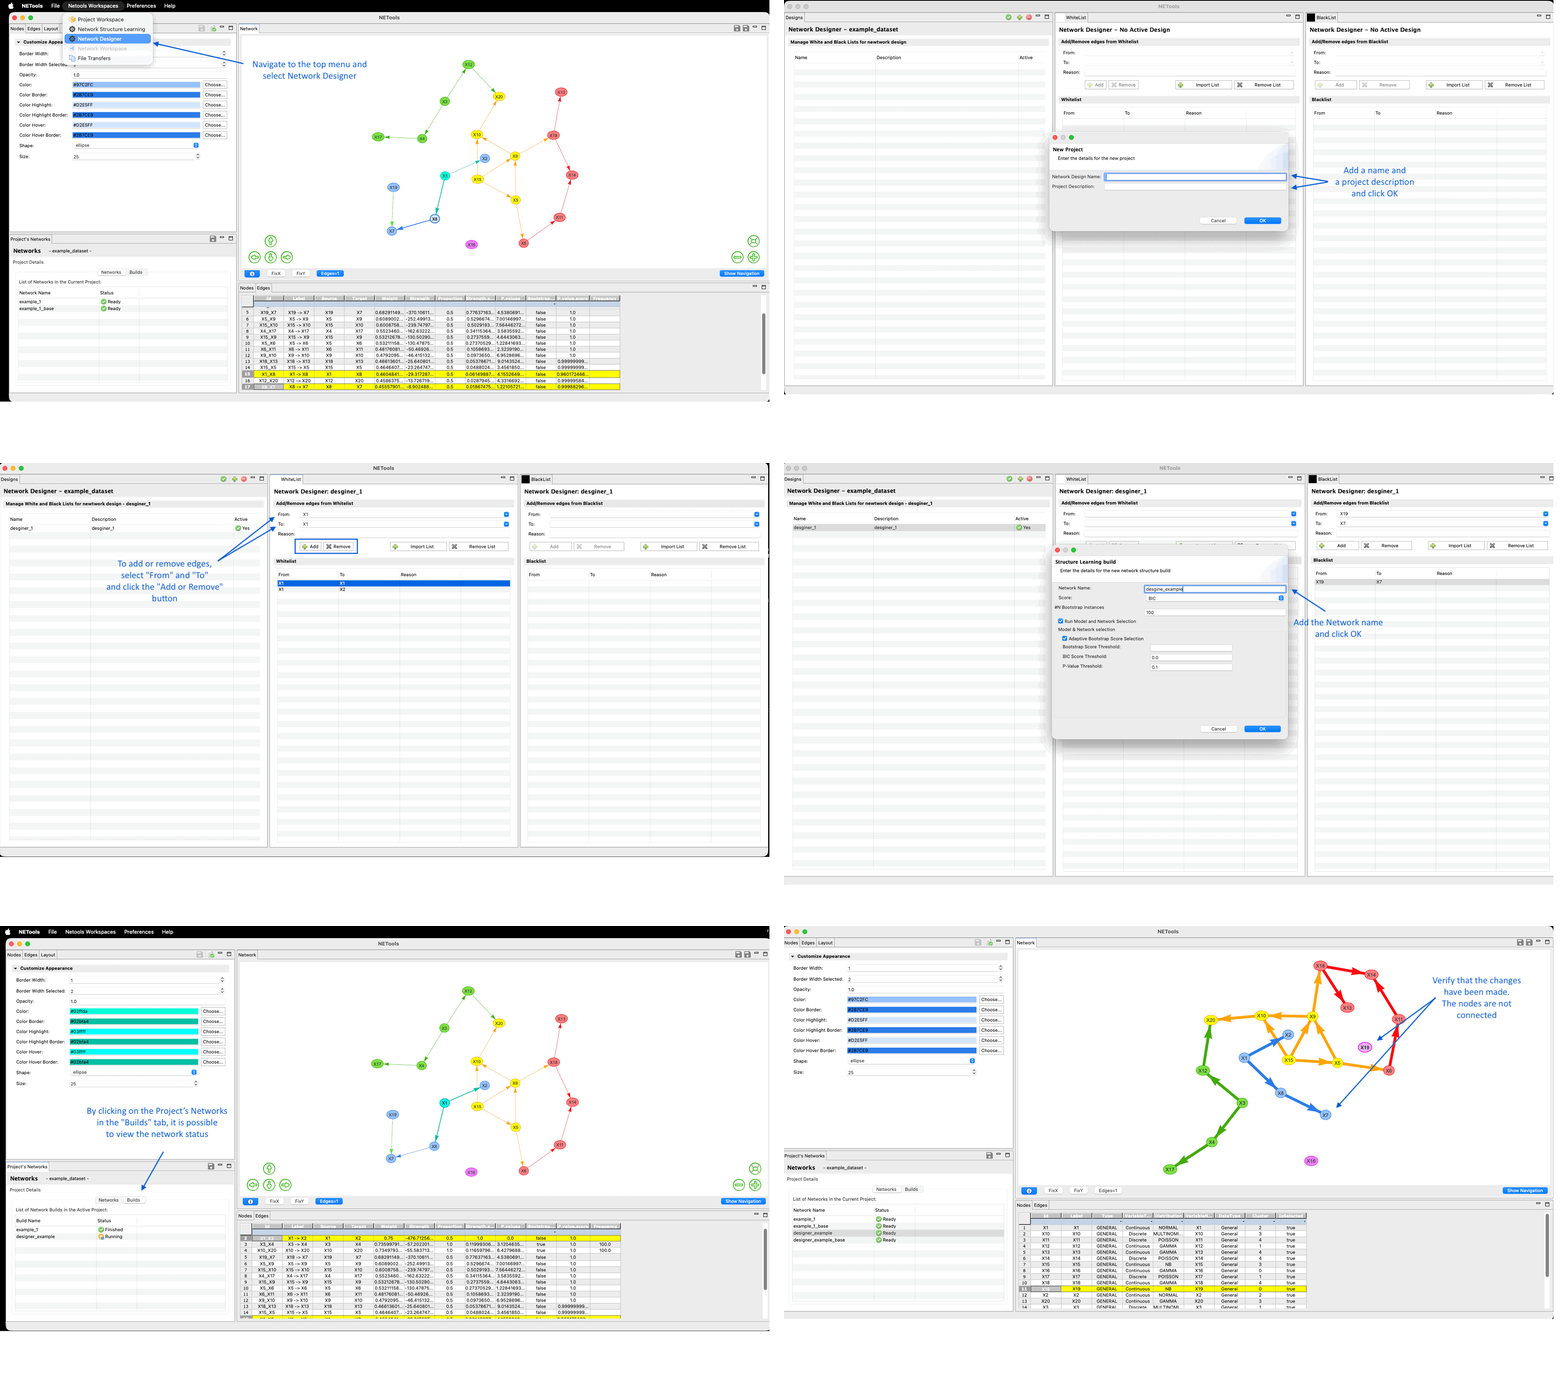
Figure 7: Using Network Designer to configure whitelist and blacklist constraints.