



OVERVIEW
1.1 - ABOUT NETOOLS
NETools is a Client-Desktop Application of the GPRO. It is an advanced software solution designed for the inference and analysis of probabilistic networks in biological and biomedical research. The application is coupled with an infrastructure of server-side dependencies (pipelines and tools) that we distribute in a container that can be installed on a remote server or on a PC with sufficient RAM. The app also includes a File Transfer Protocol system (FTP) to facilitate the upload and download of files from the user’s computer to or from the server and a progress tracker (job tracking System).
The core analytical engine of NETools implements a bootstrap-based Bayesian network construction pipeline that combines statistical rigor with high computational efficiency. Built upon the foundation of the R bnlearn library (Scutari, 2010), this pipeline extends standard Bayesian network learning methodologies with specialized adaptations tailored for complex biological and biomedical data analysis.
1.2 - VERSIONS AND DOWNLOADS
NETools is available for Windows, macOS and Linux. Download the latest version from the NETools page.
1.3 - INSTALLATION AND REQUIREMENTS
1.3.1 - INSTALLING NETOOLS IN YOUR PC
NETools is a Java application that requires at least 2 GB of RAM and Java 17 or later.
To check if you already have a JDK installed, open a command line interface and type:
java -version
Check that the reported Java version is 17 or later.
If the command is not found, Java may not be installed or may not be available on your system path.
Install Java 17 or later for your operating system, then run java -version again. If necessary, add the Java executable to your system path.
- Windows
Download the NETools.1.1.0-win32.win32.x86_64.zip file and unzip it. Then browse to the executable file “NETools.exe” and execute/run it.
- macOS
Open the downloaded macOS package and follow the installation steps. Then launch NETools.app.
- Linux
Download the NETools.1.1.0-linux.gtk.x86_64.zip file and unzip it. Then browse to the executable binary file “NETools” and execute/run it.
1.3.2 - SERVER SIDE DEPENDENCIES
NETools is a Client Side + Server Side solution thus meaning that the application is coupled via API with a bioinformatic infrastructure called GPRO Server Side that contains all the dependencies needed by NETools to execute the workflows and pipelines. The application and its workflows use the following frameworks and libraries:
Eclipse E4 Platform: Core RCP framework.
GPRO Framework: Biotechvana’s application framework.
Apache Commons IO: File handling utilities.
Google Gson: JSON processing.
Workflow Framework: GPRO-based workflow execution engine.
Vis.js Network: JavaScript-based network visualization.
The GPRO Server Side can be installed on the user’s PC or on a remote server. It is distributed in a Docker container with its dependencies. Installation instructions are available in the GPRO Server Side manual.
1.3.3 - LINKING NETOOLS WITH THE SERVER SIDE
Once the GPRO server side docker has been installed you need to link NETools to it. To do this, go to [Preferences → Pipeline connection settings] in the top menu and type the following into the configuration Dialog (Fig.1):
Your email address: to receive notifications from the server.
Host / IP address: Enter localhost for a local server, or the address of your remote server (Fig. 1).
Port number: This field should be filled only in case of you installed the server side manually and need to access via SSH. In that case the default number will be 22.
Username and password: Your ID credentials provided to access the host server.
As also shown in Fig. 1 you can also check the option “Run GPRO server locally using Docker” to let you to automatically start the GPRO container each time you run NETools (Also note that if you have this option checked you do not need to type the port). You can test if the app is connected to the Server Side clicking on the tab “Test connection settings”. Alternatively, if you install the Server Side manually (without the Docker) just add the IP of the remote server where the Server Side is hosted, add the port information (by default 22) and keep the Option “Run GPRO server locally using Docker” unchecked.
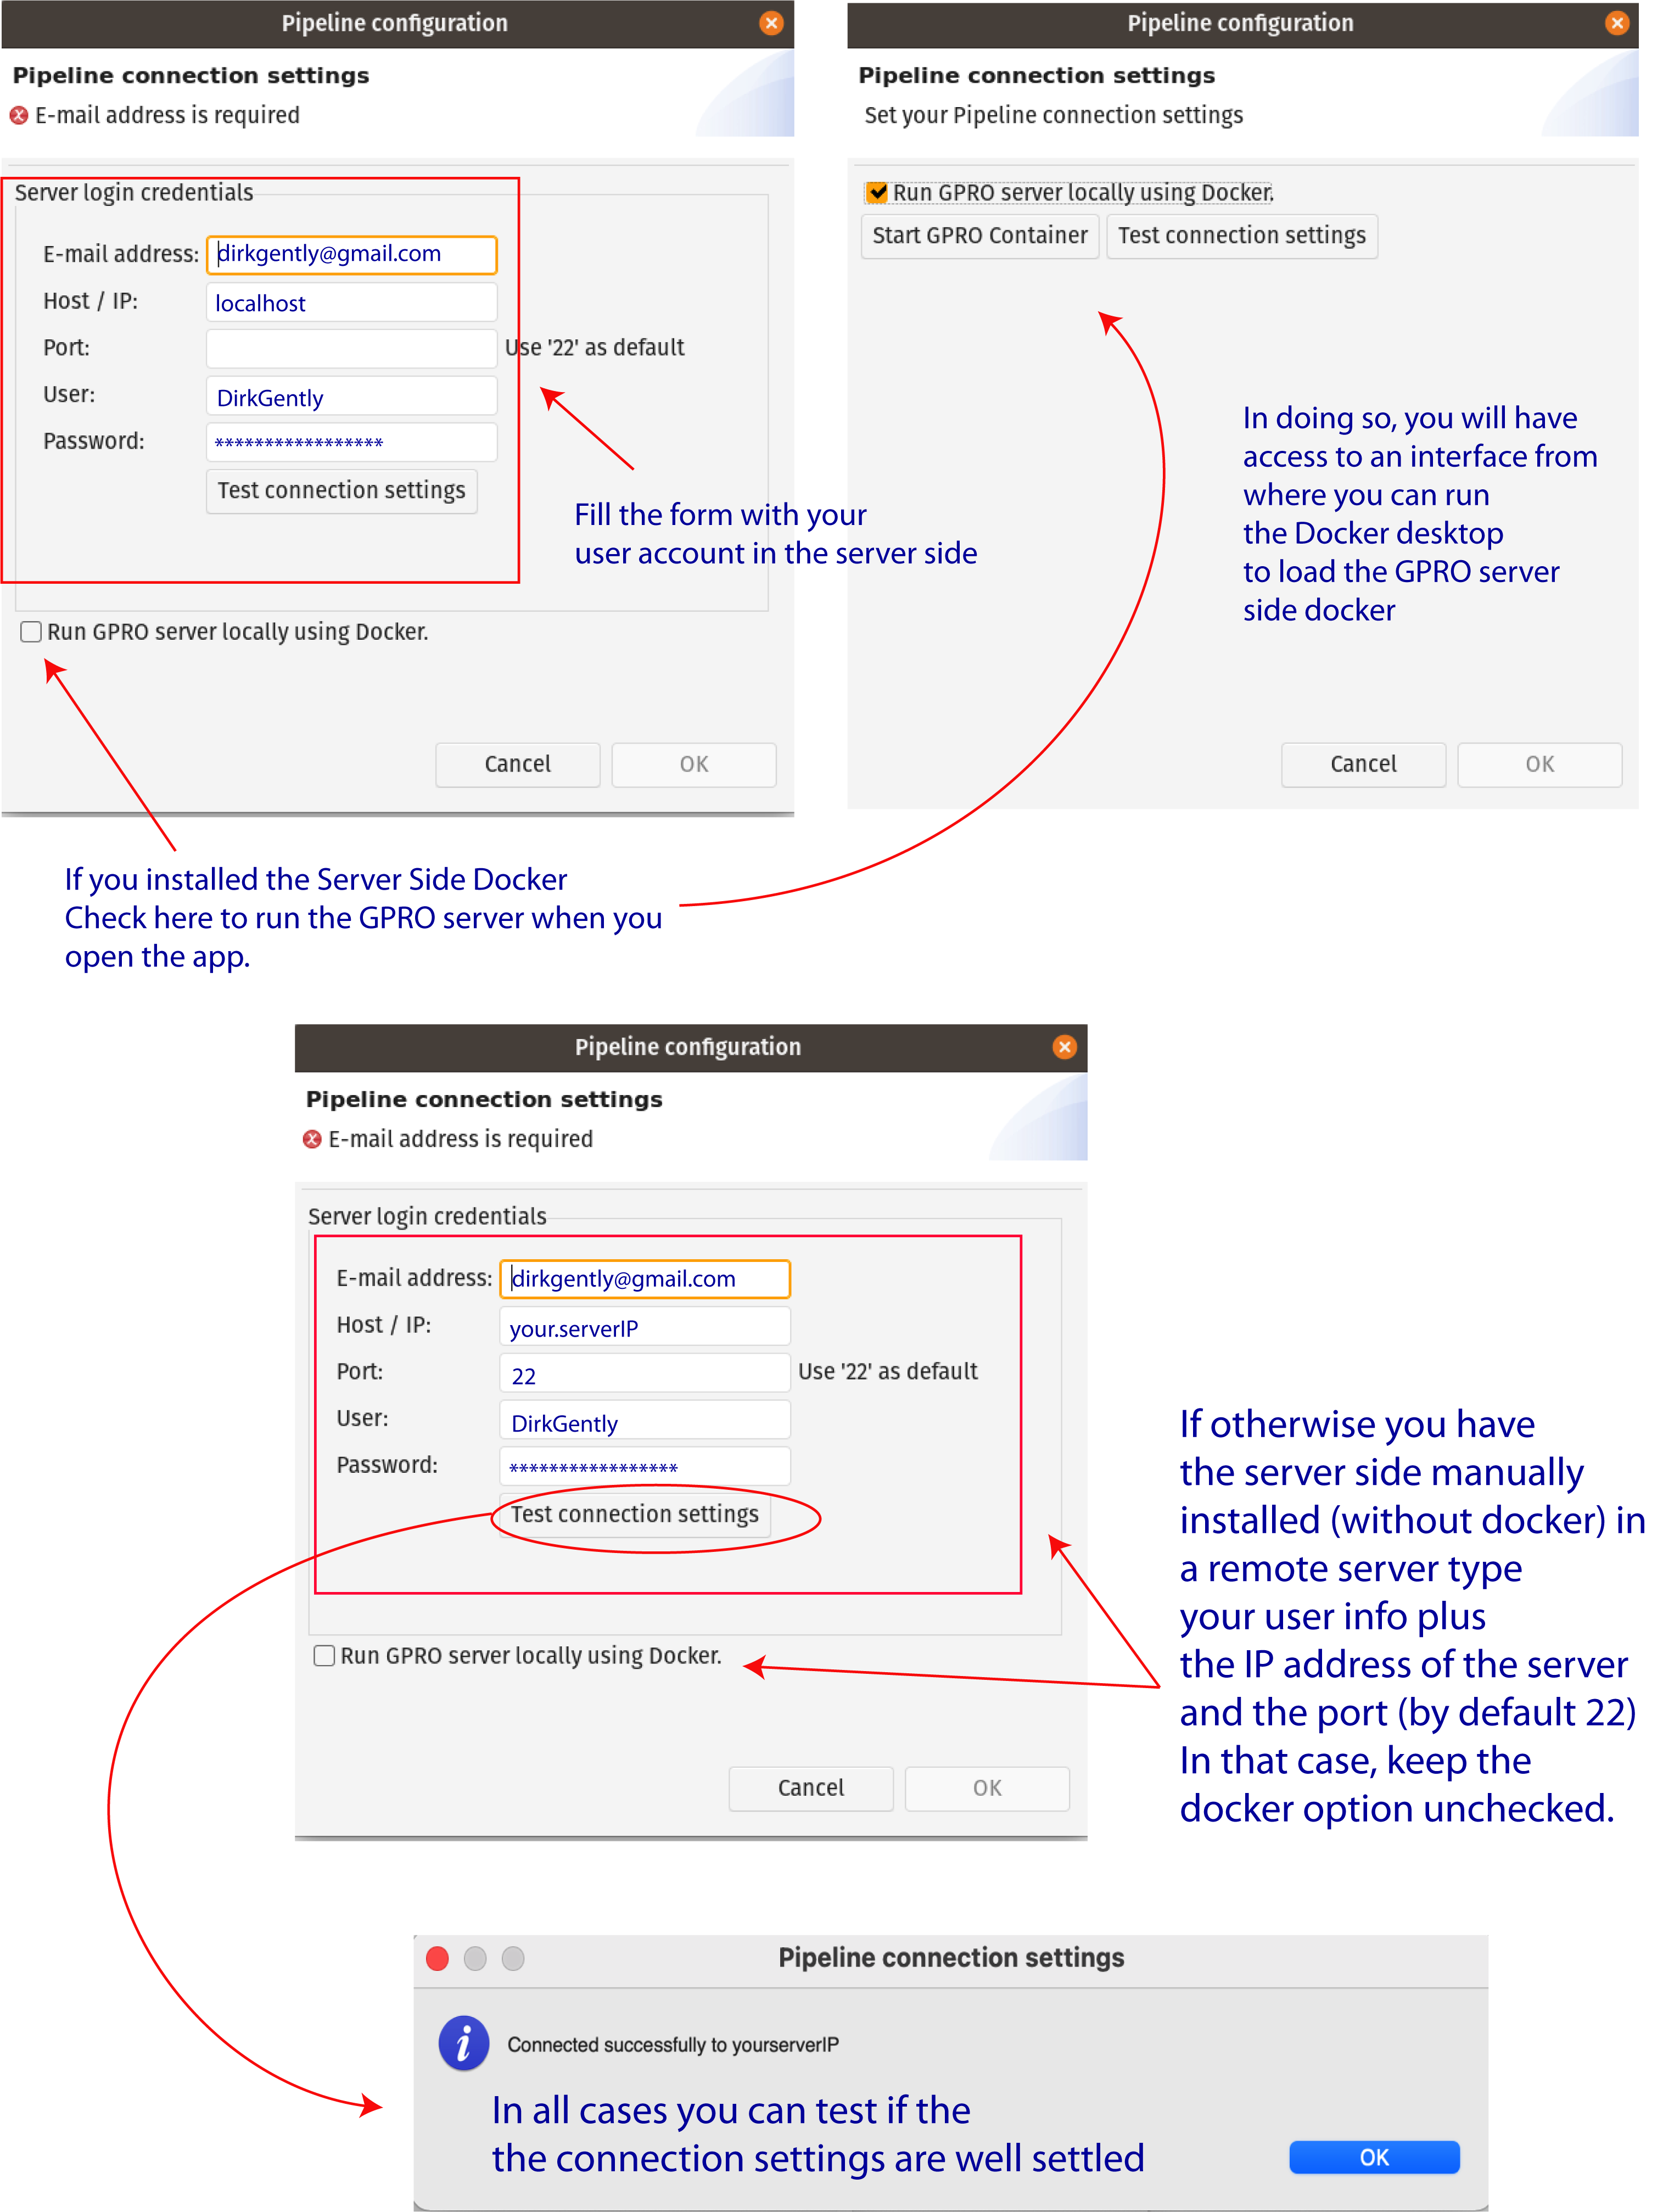
Figure 1: Server connection dialog.
1.3.4 - RAM ASSIGNATION TO YOUR PC
To modify the RAM assigned to NETools, you can edit two parameters (‘Xms’ and ‘Xmx’) in the “NETools.ini” configuration file. In Linux or Windows computers, the “NETools.ini” configuration file is located inside the NETools app folder. In macOS computers, the file can be found by right-clicking on [NETools.app → Show package contents → Contents → MacOS → NETools.ini.].
Within the “NETools.ini” file, the Xms and Xmx parameters look like this:
-Xms1024m (Minimum allocated memory)
-Xmx2048m (Maximum allocated memory)
Numeric values in the parameter names correspond to the RAM (in Megabytes) assigned to NETools. To change the amount of RAM that is assigned to the app, simply modify these values. Please keep in mind that the maximum amount of RAM assigned to NETools will depend on your computer’s total RAM. For example, if your computer has a total of 8GB of RAM, we recommend that you assign Xms2048m and Xmx4096m for optimal performance. You may even increase the value of Xmx up to Xmx6144m. We do not however recommend the use of RAM values near to the maximum available memory of your PC. This could reduce the stability of your computer’s operating system.
1.4 - GETTING FAMILIAR
1.4.1 - NETOOLS LAYOUT
The layout of NETools is structured in the following sections: the "Top Menu", the "Datasets Panel", the "Info Panel" and the "Variables View" and the "Normalization & Filtering Panel" (Fig. 2)
The NETools main window is organized into dedicated functional panels designed to streamline project management, data visualization, and exploratory analysis. Below is a description of the primary components:
TOP MENU: Located at the very top of the application window, the Top Menu provides access to global configurations and core functionalities.
DATASETS PANEL: Positioned in the upper-left section of the interface, this panel allows users to manage project data. Here you can add, remove, and monitor the status of your loaded datasets. It also includes quick-action toolbar buttons for dataset manipulation and sample inspection.
INFO PANEL: Located in the lower-left corner, the Info panel displays real-time system logs, process execution status, warnings, and error messages generated during data processing and analysis.
VARIABLES VIEW: Occupying the central and upper-right portion of the screen, the Variables View is divided into:
Filter Variables: A search bar to filter variables based on specific criteria.
Variables Table: Displays detailed information for each variable, including its unique identifier (ID), name (Name), data type (Type), statistical distribution (Distribution), missing values (Missing Data), and selection status (Selected).
Edit Selected Variable: A side panel dedicated to modifying or inspecting properties of individual variables selected from the table.
NORMALIZATION & FILTERING PANEL: Situated in the lower-right section, this panel features dedicated tabs (Normalization and Filtering) where users can apply mathematical transformations, adjust filtering thresholds, and prepare their datasets for downstream statistical analysis.
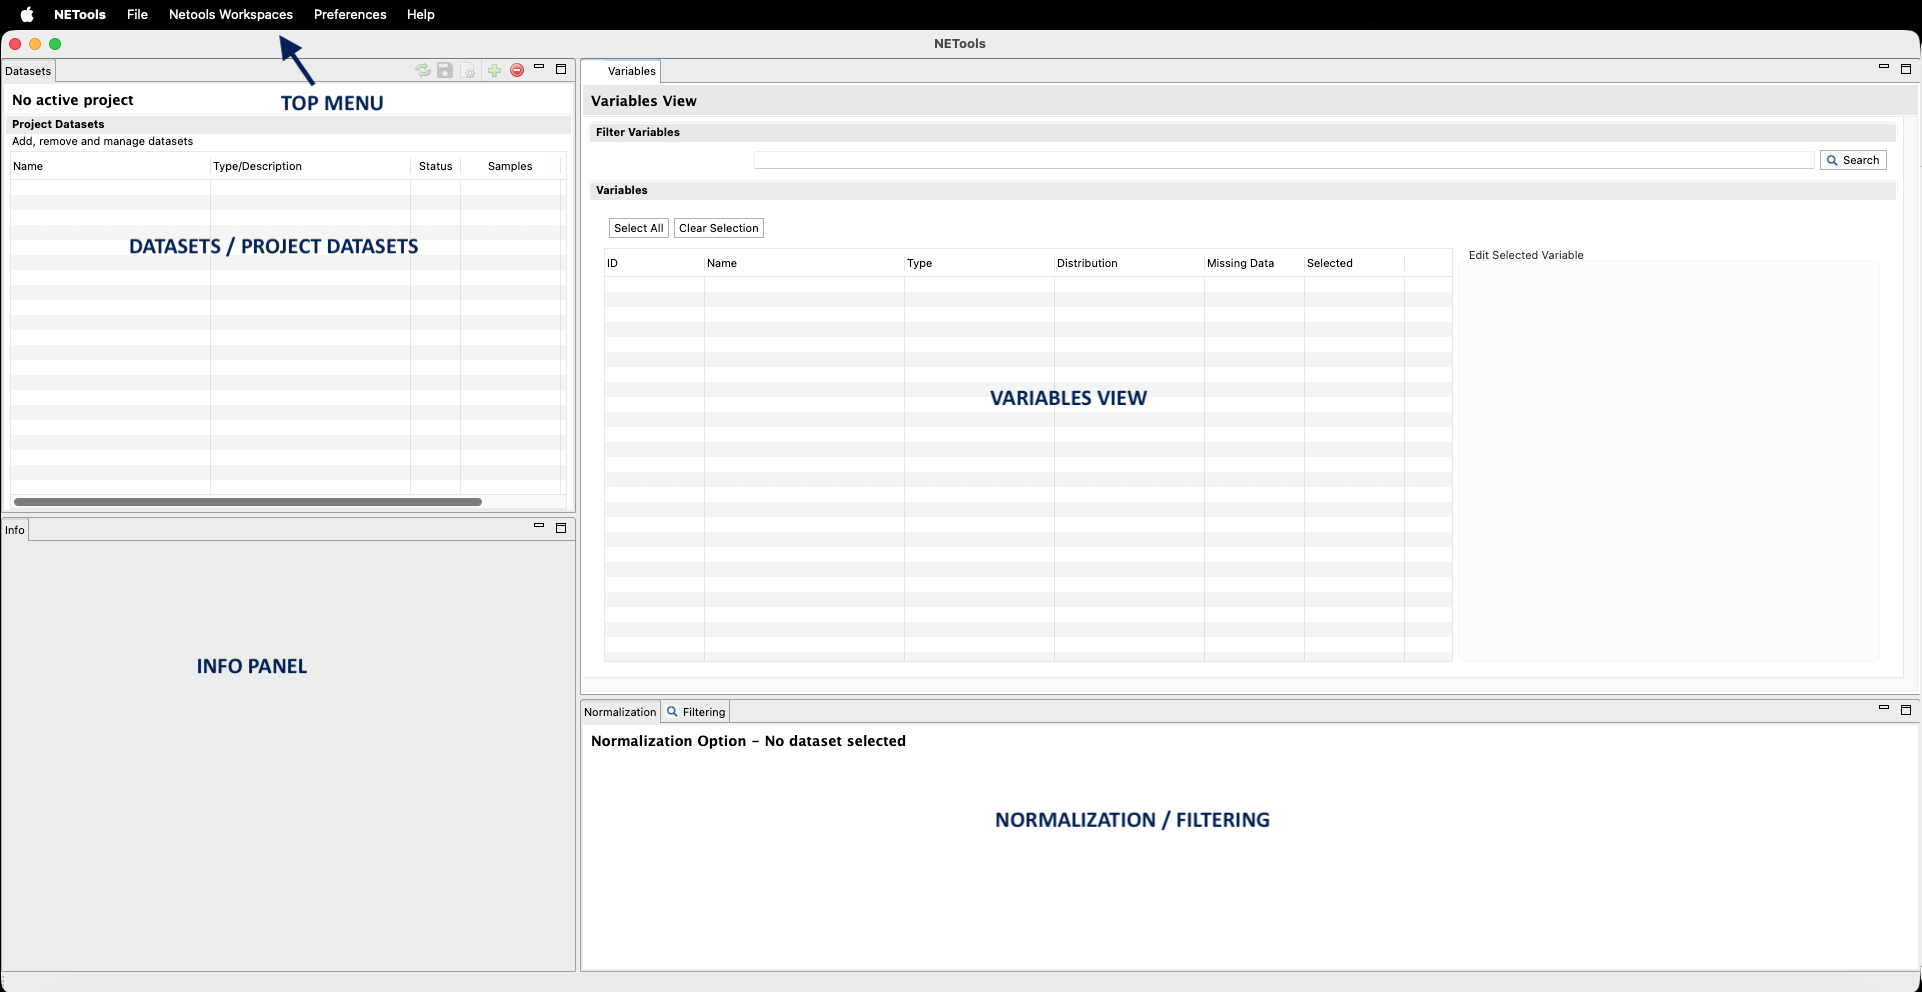
Figure 2: Main graphical user interface of NETools, highlighting the Top Menu, Datasets panel, Variables View, Info panel, and Normalization/Filtering options.
1.4.2 - FUNCTIONS OF THE TOP MENU
The Top Menu presents the following tabs, each of which has a scroll down list with the following functions:
NETOOLS:
[NETools → About / General Info]: Gives access to general application information, version details, and main program properties.
FILE:
[File → New / Open / Save]: Allows creating new projects, opening existing project files, and saving current workspace states or datasets.
NETOOLS WORKSPACES:
[Netools Workspaces → Manage Workspaces]: Provides tools for creating, switching between, and organizing different analysis workspaces and project environments.
PREFERENCES:
[Preferences → Pipeline Connections Settings] : Gives access to the server login details setup your user credentials for accessing the server.
HELP:
[Help → About] : Technical details and copyright of NETools, as well as links to the license and user manual.
1.4.3 - SOME BASICS ON THE NETOOLS INTERFACE
The NETools interface for network analysis and visualization is structured into functional panels that allow users to customize graph properties, manage project networks, and inspect elements (Fig. 3).
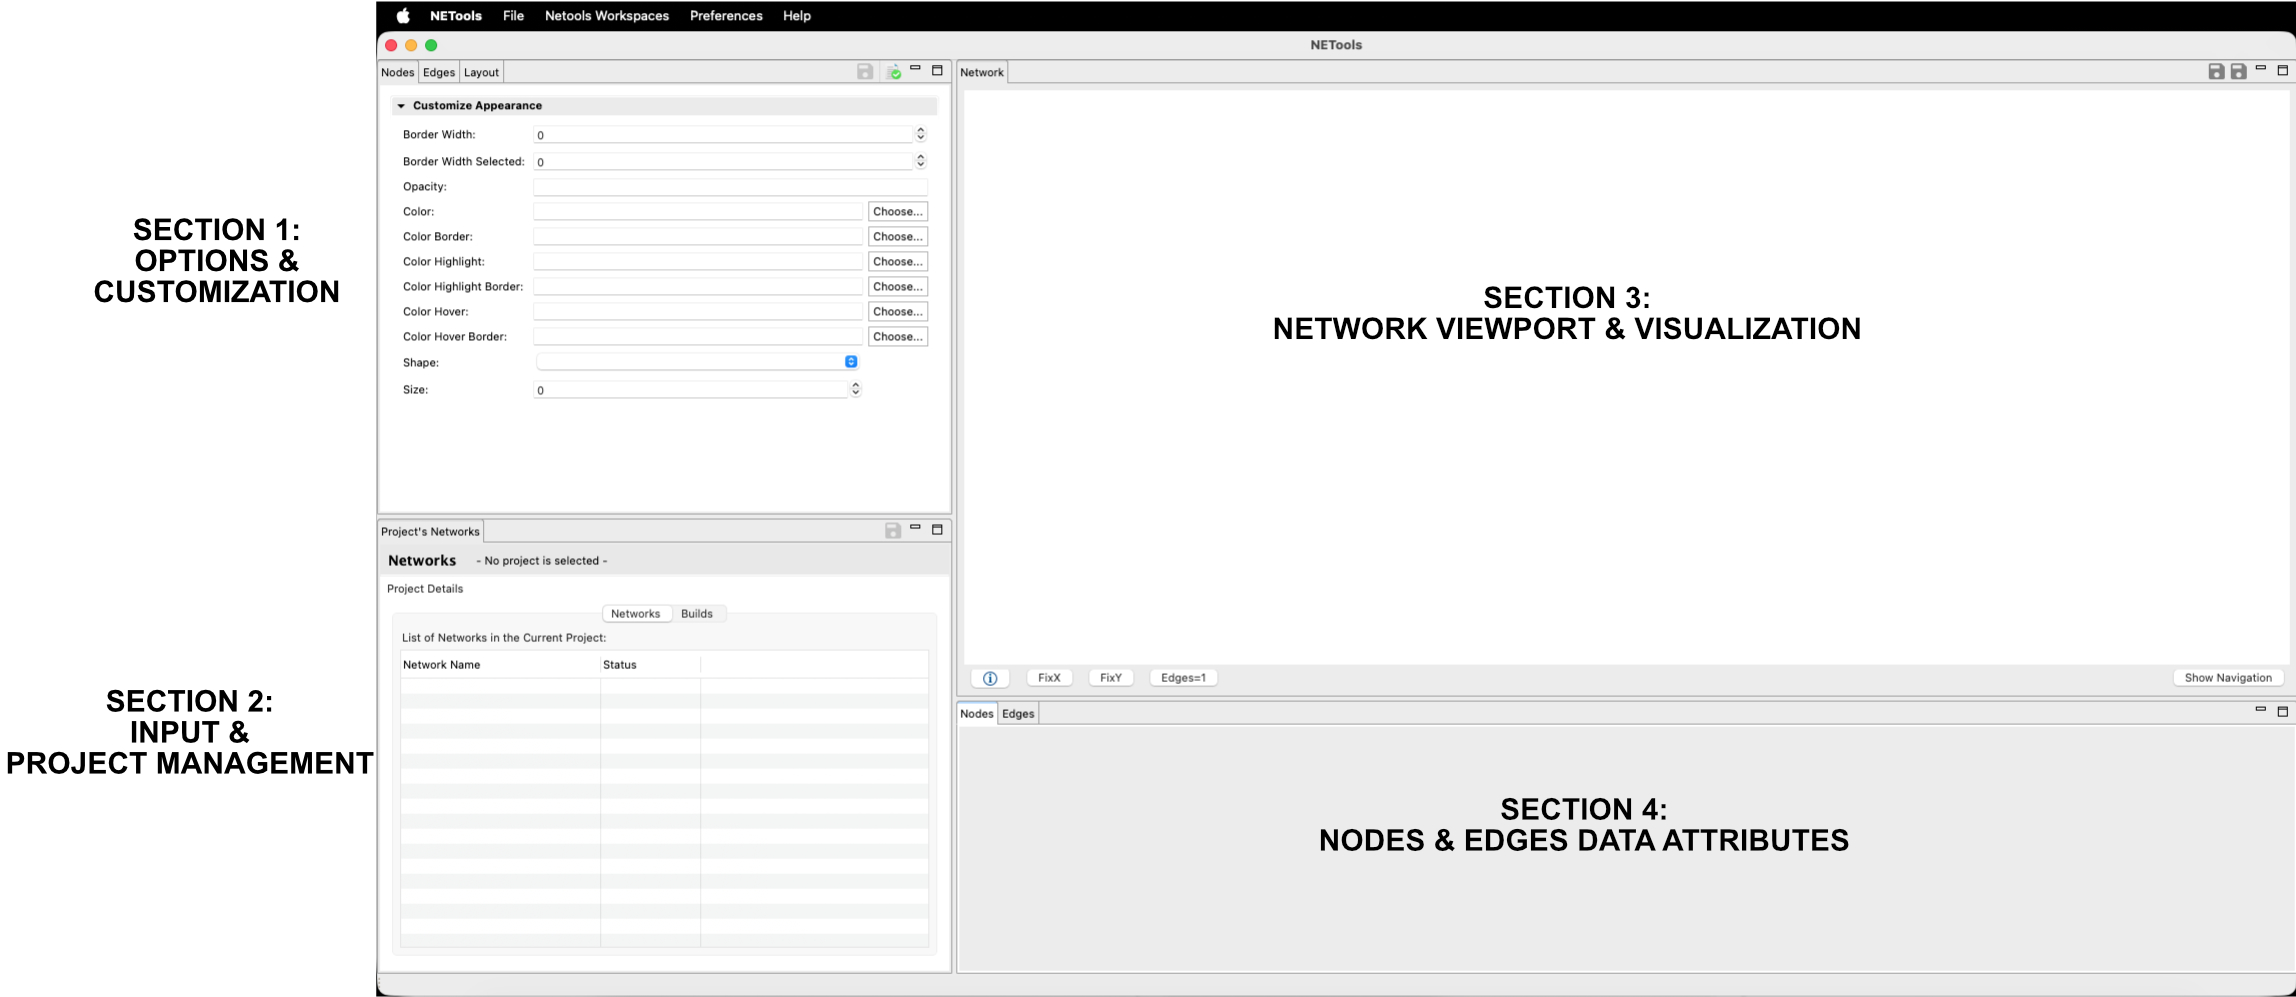
Figure 3: NETools network visualization interface, including appearance controls, project networks, the network viewport and the nodes and edges data tables.
Below is a detailed description of the main components:
Customization Appearance Panel (Section 1):
Located in the upper-left section, this panel provides controls to customize the visual properties of network nodes and edges. It includes settings for:
- Border Width & Border Width Selected: Adjusts the thickness of node borders.
- Opacity: Controls the transparency level of the elements.
- Color parameters: Dedicated options to choose colors for nodes, borders, highlights, and hovers (Color, Color Border, Color Highlight, etc.).
- Shape & Size: Dropdown and numerical fields to modify node geometry and scaling.
Project's Networks Panel (Section 2):
Positioned underneath the appearance settings, this panel manages the networks associated with the active project. It includes tabs for Networks and Builds, displaying a table with the list of loaded networks (Network Name and Status).
Network Viewport (Section 3):
This central section acts as the primary interactive canvas where the biological or interaction network is rendered. It includes navigation tools, layout fix buttons (FixX, FixY), element counters (Edges=n), and viewport controls (Show Navigation) to inspect and manipulate the graph structure dynamically.
Nodes / Edges Data Panel (Section 4):
Located at the bottom right of the interface, this tabular section provides detailed data attributes, metrics, and metadata corresponding to the selected nodes and edges within the network graph, allowing for precise data inspection and analysis